WorkMonitor · Workforce Insights
See who is working on what, right now.
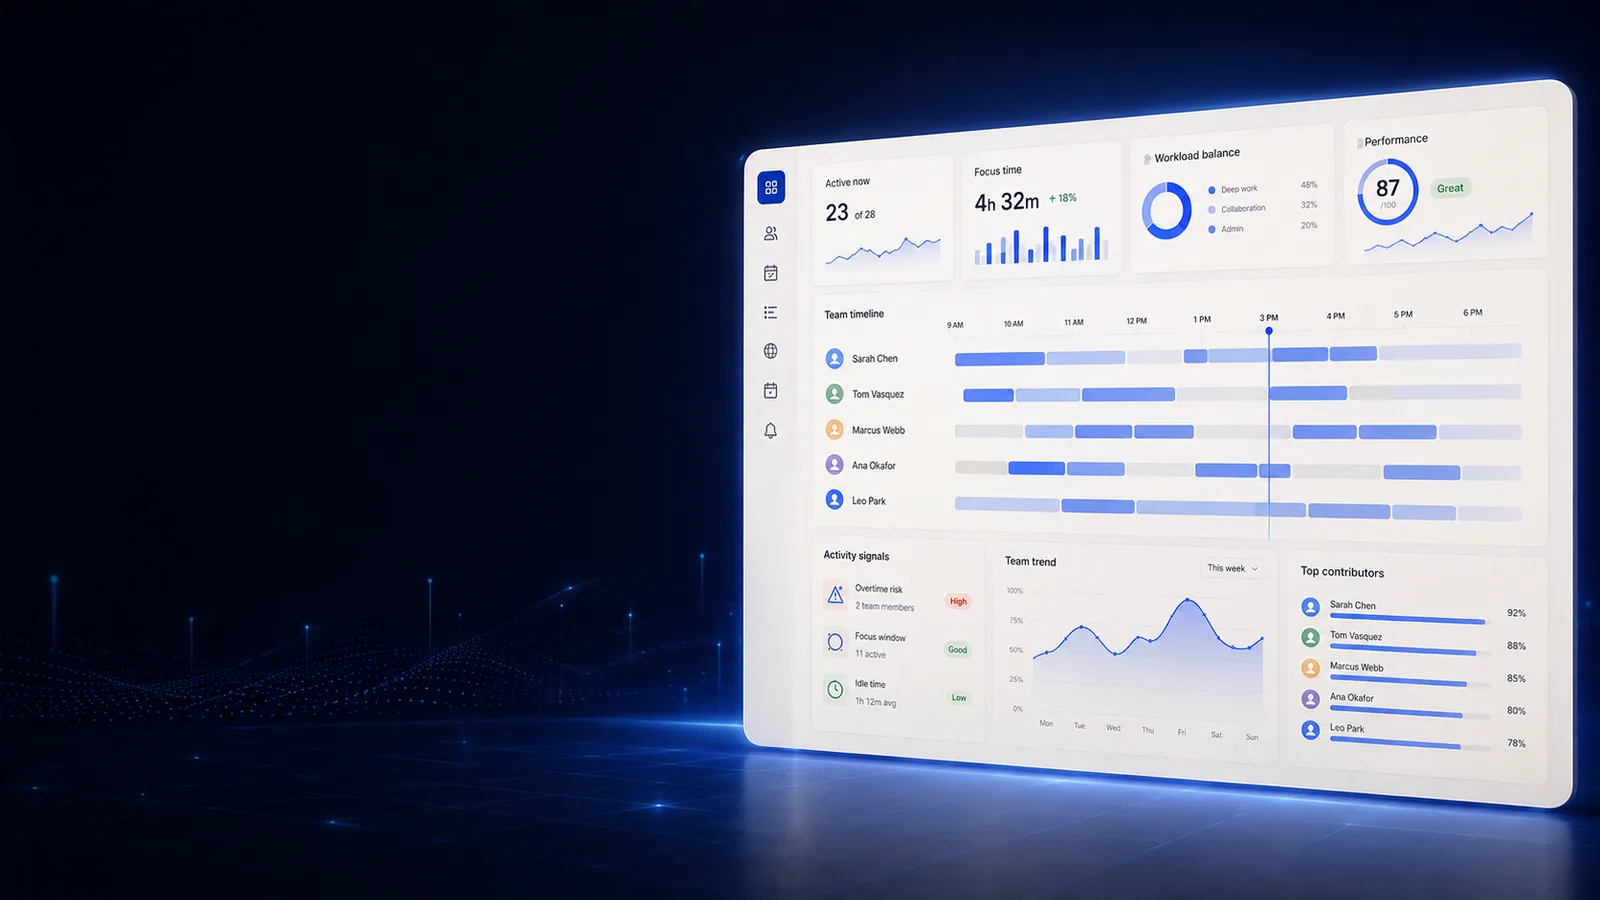
Nobody can tell you how the week actually went. This can: a live board of who is on what, scores that open into the activity behind them, and an alert when the hours stop adding up.
Free for two seats, no card.
Monitoring & Analytics
The board, the score, and what sits under both
Pick one and the screen it lives on opens beside it, so you judge Monitoring and Analytics on what it puts in front of a manager rather than on a list of nouns.
- AKMonitoring & AnalyticsA clear picture of the working week.Search or ask…
- Today
- Insights
- Activity board
- Live screens
- Team
- Agents
- Integrity
- App categories
- Reports & digests
- Capacity
Northlight StudioInsightsFocus, deep work and meeting load, week by weekFOCUS INDEX73/ 1002 vs last week0 = scattered · 100 = deep workHeadcount-weighted across 6 teams · Mon to Wed scoredFOCUS BY DAYweek avg 73707673————MonTueTodayThuFriSatSunWhat moved the indexDeep work +12%Meeting load −9%Idle and break time held flatTEAMFOCUS INDEXΔ WEEKHOURS- Product7824131h
- Design476172h
- Engineering14756262h
- Operations271235h
- Support9682168h
- Sales6643108h
776h captured so far this week, idle included · across 42 peopleWeek 36 to date
- Today
- Insights
- Activity board
- Live screens
- Team
- Agents
- Integrity
- App categories
- Reports & digests
- Capacity
- Product7824131h
- Design476172h
- Engineering14756262h
- Operations271235h
- Support9682168h
- Sales6643108h
How it works
From one installed agent to a picture you can act on
- 1
Deploy one agent
One installer, one enrolment, and the whole fleet reports in. Signed packaging and auto-update keep every machine current, so there is never a second rollout to plan.
- 2
Set what is captured
Capture policy per team and per region, so each part of the business is measured the way it actually works. Per-app deny-lists keep sensitive tools out of the record entirely.
- 3
Classify and score
Apps resolve through a shared directory and your own category overrides. Out comes focus, deep work and capacity, for one person, one team or the whole org.
- 4
Act on the feed
Anomalies are measured against your own baseline and land in email or Slack, with the day reconstruction one click behind them. You look on Tuesday, not at month end.
An activity percentage vs. a number that survives the conversation
workmonitor.vsActivity-percentage tools
What the number means
With WorkMonitor
Focus, deep work, category and idle, combined into a score whose components you can inspect one by one.
Activity-percentage tools
Keystrokes and mouse movement per minute, which rewards fidgeting and penalises reading.
When you act on the number
With WorkMonitor
The breakdown opens. The decision rests on what was actually worked on, not on a percentage nobody can check.
Activity-percentage tools
There is nothing behind it to open, so a performance conversation turns into an argument about the tool.
Whose definition of productive
With WorkMonitor
Yours. Category overrides and a per-app deny-list mean the classification describes your business rather than a vendor’s idea of one.
Activity-percentage tools
The vendor’s, baked into a category list you cannot change.
Live vs. stale
With WorkMonitor
Online status is the only liveness claim we make. Classification and last-active-app read as the history they are.
Activity-percentage tools
An eleven-minute-old snapshot presented as though it were live.
Data you would rather not hold
With WorkMonitor
Deny-listed on the device. The row is never created, so it cannot leak and cannot be demanded in discovery.
Activity-percentage tools
Captured, then filtered in a report, so still collected, still stored, still able to leak.
Admin access to the record
With WorkMonitor
Every access lands on a hash-chained log, so who opened what is a question with an answer.
Activity-percentage tools
Unlogged, so a claim that somebody went digging cannot be settled either way.
- Today
- Insights
- Activity board
- Live screens
- Team
- Agents
- Integrity
- App categories
- Reports & digests
- Capacity
- AKAria K.Figma92Active
- JMJon M.Terminal78Active
- SDSara D.Slack61Active
- RPRavi P.Notion34Idle 11m
- LMLena M.Teams55In a call
- TVTomas V.Off shift0Off
Every capability in Monitoring & Analytics, and exactly where each one stands
- Live activity board
- Live screens (a frame every few seconds, nothing stored) — Business and above
- Screenshots & gallery
- Activity timeline / day reconstruction
Ask AI
Ask AI about your team's work
Ask in plain language and get an answer built from the activity record, with every claim traceable to a captured signal rather than to a guess.
Pick a question above and WorkMonitor AI will answer from your team's real numbers.
By team
Who watches this board
Use cases
The jobs it gets bought for
Each one opens on the page written for that job — the same capabilities, read from the work rather than from the product.
- Score productivity & focusOne score per person, team or company, with the breakdown behind every one. Your categories rather than our defaults, and a capacity signal that names who is running hot.
- Monitor apps & websitesEvery app and site classified, every day replayable as a timeline. You see which tools are eating the week and which teams they are fragmenting.
- Capture screenshots on your termsA randomised cadence, exclusions applied on the device, retention that expires, and the consent record and appeal route that keep the programme standing.
- Catch anomalies with smart alertsAnomaly detection against your own baseline, six named agents on specific jobs, evidence-cited summaries, and delivery to a channel your team already reads.
Straight answers
The questions we would ask in your position
Every answer here is the one you would get on a call. Open as many as you like; they stay open, so two can be held side by side.
No, and the difference shows in what you can do with the output. Every score opens into the activity that produced it, so it holds up in a review, a client conversation or a dispute — which a black-box percentage never does. Sensitive apps sit on a per-app deny-list and never enter the record, agents carry on-device privacy guarantees, and the transparency view in Trust & Compliance keeps the whole programme defensible.
Every score is assembled from classified app activity: category breakdowns, heatmaps, and rollups from person to team to org. The explainability view names which activity produced which number, and you override a classification the moment the default misreads how your team works. The definition of productive is yours to set, which is why the number is yours to defend.
macOS is live today, alongside a VS Code companion with a developer self-view. Windows, Linux and a browser extension are in beta, and a mobile app for deskless teams is planned. Every agent ships with on-device privacy guarantees, so the narrowing happens on the machine rather than in a report afterwards.
Yes, and it protects the company as much as the person. The per-app privacy deny-list stops named apps from ever entering the record, so that data never exists to leak, to be demanded in discovery, or to be argued about. Classification overrides correct how the rest are categorised, and the capture policies in Trust & Compliance make what you collect a decision you can show.
Yes. A BI warehouse export ships as a connector in Integrations, so scores, categories and activity rollups land in your warehouse beside everything else you model. Scheduled reports and verified-hours digests deliver to your existing channels as well, for the managers who will never open a BI tool.
Take these with you
The software is the easy part of a rollout
Here is what we would send a manager doing one for the first time: how to read a productivity number, what to say to a remote team before anything is installed, and a policy you can adopt as written.
Point it at one team for a week.
Create the account, put the agent on a handful of desks, and leave it alone. On Friday you read the week instead of reconstructing it: hours against their projects, focus and idle per person, and the timesheets already filled in.
Free for two seats. No card, and no sales call to sit through.